
UCAT Decision Making: Venn Diagram Questions Explained

Introduction to UCAT Venn Diagram Questions
The UCAT (University Clinical Aptitude Test) is an admissions test required by most UK medical and dental schools. Within its Decision Making (DM) section, one tricky question type involves Venn diagrams – those overlapping circle diagrams from maths class. In UCAT DM, Venn diagram questions assess your ability to interpret and analyse group relationships and statistics. You might be asked to calculate values from overlapping sets or deduce which diagram matches a given scenario. The good news? With practice, these can actually become some of the quickest (and highest-scoring) DM questions to solve. In fact, official data shows Venn diagram questions are among the easiest DM item types for candidates. So, mastering them is a smart way to boost your score! 🏆
Why Venn Diagrams? As a doctor or dentist, you’ll often need to make sense of complex information with overlapping factors – much like a Venn diagram. The UCAT uses these questions to assess your logical reasoning and basic numeracy under time pressure. Don’t worry – you won’t need advanced maths. But you will need to be comfortable with percentages, probabilities, and the language of sets (e.g. “all,” “some,” “none,” “at least”) in practical contexts. This guide will help you visualise group overlaps and apply some quick maths tricks so you can find the correct answers quickly and accurately. Let’s break down what to expect and how to tackle each format step by step.
What Are Venn Diagram Questions in UCAT DM?
Venn diagrams use overlapping circles (or other shapes) to represent groups or categories and their relationships. In UCAT Decision Making, Venn diagram questions typically fall into a few subtypes:
Type 1: Interpreting a Given Venn Diagram. You’ll see a diagram with numbers or data in various overlapping regions. You must interpret it and select the best conclusion or answer from a list of statements. For example, you might be shown a Venn diagram of survey results and asked which statement about the data is true. This tests your ability to read the diagram correctly and make inferences.
Type 2: Creating a Venn Diagram from Information. You’re given a text passage or a set of facts (e.g. “X people have quality A, Y have quality B, Z have both…”). You need to visualise the overlaps (often by sketching a quick Venn diagram on your noteboard) and then use that visualisation to calculate an answer or draw a conclusion. These questions often involve a bit of maths – adding or subtracting overlapping group sizes – to find a number or identify which statement must be true.
Type 3: Selecting the Diagram that Matches. You’re given several answer options each showing a different Venn diagram. The question provides a scenario or set of conditions in words, and you must choose which diagram correctly represents that information. Essentially, you have to mentally integrate the statements (“All A are B”, “Some B are C”, etc.), possibly by drawing your own diagram, then pick the diagram that fits. This tests your visual logic skills.
In all cases, there will be only one correct answer per question (DM Venn diagram items are usually in multiple-choice format). Now, let’s go through strategies to ace each type!
Understanding Venn Diagrams: The Basics
Before jumping into strategies, make sure you’re comfortable with basic Venn diagram concepts:
Each circle (or shape) = a group/set. For example, one circle might represent “dog owners” and another “cat owners.” Numbers inside a shape usually indicate how many elements (people, items, etc.) are in that category.
Overlap regions = in both groups. Where circles overlap, the number there belongs to both categories. If two shapes overlap, the number of overlapping sections counts toward both groups. If three circles all overlap in one spot, that number is in all three groups, and so on.
“Only” vs “At least.” A number written in a non-overlapping part of a circle means those items are only in that one category (not in any overlap). A number in an overlapping segment means those items are in at least two categories. Understanding wording like “only X,” “at least X,” “none,” or “all” is crucial. For instance, “only dog owners” would correspond to the non-overlapping part of the Dog circle, whereas “dogs and cats” implies the overlap between those two circles.
The total count of a category = the sum of all sections of that circle. For example, if 6 people are in only the Dog circle and 3 are in the Dog-Cat overlap, then a total of 9 people own dogs. (We’ll see this in the figure below.)
None or outside: Sometimes a question mentions people/items who are in none of the groups. These would be represented as a single number outside all circles.
To illustrate, consider a simple Venn diagram with two sets: Dog owners and Cat owners.
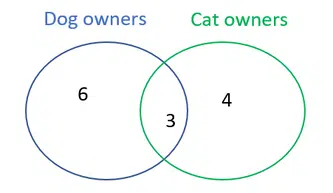
Figure: A simple two-circle Venn diagram. The left 🔵 circle represents dog owners and the right 🟢 circle represents cat owners (with overlap for people who own both pets). In this example, 6 is in the blue-only region (6 people own only dogs), 4 is in the green-only region (4 people own only cats), and 3 is in the overlapping area (3 people own both dogs and cats). From this diagram, we can deduce that 9 people own dogs in total (6 only dog + 3 both) and 7 people own cats in total (4 only cat + 3 both). Understanding how to read such overlaps is the first step in tackling Venn questions.
Most sixth-formers have encountered Venn diagrams in maths or science classes, so the concept might be familiar. The key in UCAT is applying it quickly and accurately to new information. Remember: the exam doesn’t require advanced set theory – just solid logical reasoning and basic arithmetic. Even the official UCAT advice suggests brushing up on Venn diagrams and basic probability as part of DM prep. Next, we’ll move on to strategies for solving UCAT-style Venn diagram problems efficiently.
Common Venn Diagram Question Formats & How to Solve Them
Let’s break down each major format of Venn diagram question you may encounter, with tips on how to approach them:
1. Interpreting a Given Venn Diagram
In this format, the question provides a Venn diagram already filled with numbers or data, and then asks something like “Which of the following conclusions is best supported by the diagram?” or “How many people have [some characteristic]?”
What to do:
Read the question first. 💡 Tip: Always read what the question is asking before you dive into interpreting every number. This helps you focus on relevant parts of the diagram. For example, if the question asks “How many people own either a cat or a dog, but not both?”, you know you’re looking specifically at the non-overlapping sections of two circles (the “either/or but not both” means the union minus the overlap). Don’t get distracted by data that isn’t needed.
Identify relevant regions. Once you know the task, zero in on the parts of the Venn diagram that matter. In the above example, you’d highlight the segments that are only in one circle and exclude the overlapping part. Many diagrams will have multiple overlaps (especially if 3 circles are involved), so figuring out which sections correspond to the condition in the question is crucial. A common trick: shade or mark the sections mentally (or even with your pencil on the provided noteboard) that satisfy the condition.
Apply quick arithmetic. These questions often require adding or comparing numbers from the diagram. You usually won’t need a calculator if you’re clever: the numbers are generally small, and there are often shortcuts. For instance, one official practice question asked for the sum of all numbers that lie in the area where three or more sets overlap. Instead of adding four numbers like 9 + 26 + 32 + 12 outright (which you can certainly do), a fast maths trick is to just add the last digits: 9+6+2+2 = 19, so the total must end in 9 – and if answer options are far apart, this can quickly point you to the correct choice (79 in this case). Such techniques save precious seconds. Another example: if you need to add many numbers, grouping them into tens or using simplifications can speed things up. Always double-check you’re adding the right segments.
Double-check the logic of statements. If the answers are statements (e.g. “All students who play piano also play guitar”), use the diagram to verify each one. Eliminate options that clearly contradict the diagram. It may help to translate statements into Venn terms (e.g. “all piano players also play guitar” means the Piano circle would lie entirely inside the Guitar circle – is that the case in the diagram?). The correct conclusion will be the one fully supported by the visual data, while wrong options will misrepresent the overlaps or counts.
Example: Suppose a Venn diagram shows three circles (A, B, C) with various numbers. The question asks: “According to the diagram, which one of these statements is true?” You would check each statement against the diagram:
“All A are B” – is the entire A circle within B? If you see any part of A outside B, that statement is false.
“More people are in A ∩ C than in B ∩ C” – compare the numbers in the overlap of A&C vs B&C.
Etc.
The diagram itself is your evidence. Use it systematically to test each statement. Many students find these easier than text-based logic questions, because you can literally see the relationships. As one UCAT tutor notes, Venn diagram questions in DM tend to be quite straightforward if you interpret the shapes and numbers carefully. Practice reading off totals and overlaps from diagrams so you can do it at a glance.
🔴 Live UCAT Course – Limited Places Available
The UCAT is competitive — your preparation shouldn’t be.
Join our live, expert-led UCAT course and get real-time guidance to boost your score, build confidence, and secure medical or dental interviews.
Why students choose Blue Peanut:
- Live teaching with opportunities to ask questions
- UCAT-focused strategies that actually work
- Clear, step-by-step guidance for every UCAT section
- Built by doctors & admissions experts
- Trusted by students applying to top UK medical & dental schools
👉 Places on our live UCAT course are limited.
Book now to secure your spot and stay ahead of the competition.
2. Visualising a Passage as a Venn Diagram
Here, you get a word problem or a list of facts instead of a pre-drawn diagram. For example: “In a survey of 100 people: 60 like tea, 50 like coffee, 20 like both tea and coffee. 10 people like neither. How many people like only tea?” This is a classic two-circle Venn scenario described in words. Or you might get a more complex scenario with three categories, e.g. students taking different subjects or patients with symptoms, etc.
What to do:
Draw a quick sketch. Don’t worry about artwork – a rough Venn diagram on your wipe-clean noteboard can be a lifesaver. In fact, experts strongly encourage sketching out the information for these questions. Draw circles for each category and label them clearly (e.g. “Tea” and “Coffee”).
Fill in known values systematically. Use a step-by-step approach: start with the most overlapping parts first (this is key!). If the problem involves two sets, begin with the overlap (both). For three sets, start with the “all three” intersection if that’s given, then the pairwise overlaps, then the single-set only areas. This prevents double-counting. In our tea/coffee example, you know 20 like both, so put 20 in the overlapping area. You know 60 like tea in total – that total includes those who like both, so the number who like tea only = 60 – 20 = 40. Similarly, coffee only = 50 – 20 = 30. Always subtract overlaps from totals to avoid counting the same people twice. If the problem adds a third category (say, “20 like milk as well”), you’d subtract appropriately for triple overlaps, etc. It’s like solving a little puzzle: fill what you can, then use subtraction to find hidden values.
Watch out for “none” or outside group. If the question mentions some people have none of the characteristics (neither/nor), remember to account for them as well. They would be outside all circles. For instance, in the tea/coffee survey, 10 like neither, which means Tea ∪ Coffee = 90 (since 10 are outside). It can be a useful check: the sum of all regions inside the circles plus “neither” should equal the total surveyed (100). If your numbers don’t add up, double-check your subtractions.
Answer what’s asked. Once your mental or sketched diagram is complete, extract the answer. Perhaps they ask “How many like only tea?” (that would be the tea-only segment you calculated, 40 in our example), or something like “How many people like at least one of tea or coffee?” (that would be the union: total in tea + total in coffee – both, or simply total surveyed minus neither). By translating the wording into the appropriate combination of segments, you can quickly get the answer from your diagram.
Use algebra if needed for unknowns. Occasionally, not every number is given outright – you might have to set up a simple equation. For example: “100 students; 70 like English, 55 like Maths, 40 like both. How many like neither?” Here, let x = number who like neither. You know those who like at least one = 70 + 55 – 40 = 85 (by the inclusion-exclusion principle). These 85 plus the neither (x) must total 100, so x = 15. This is basic algebra, and it’s worth practising a couple of such problems so you’re comfortable formulating them under time pressure. Often the structure is:
Total = sum(individual sets) – sum(overlaps of 2) + (overlap of 3) – … + neither. Don’t panic – with one or two sets it’s straightforward, and even with three sets it’s manageable by filling in stepwise.
Speed tip: many Venn problems in UCAT DM involve only adding/subtracting a few numbers. Mental maths (or using the provided pen & paper) is usually faster than pulling up the on-screen calculator for these. Save the calculator for more complex arithmetic in other questions (since switching to it and typing takes time). You should be able to do small additions or subtractions in your head or quickly on paper. Practice doing these operations quickly and accurately. As the saying goes, “measure twice, cut once”: double-check that you’ve subtracted correctly and assigned numbers to the right regions. A small mistake in placing a number could lead to a wrong answer.
Finally, once you have your completed Venn diagram, answer the question and double-check it against the info given to ensure consistency. If something doesn’t add up, revisit the clues – perhaps you mis-read “only” as “both” or vice versa (a common pitfall).
3. Choosing the Correct Venn Diagram from Options
In this format, the question provides a set of statements or a scenario, and the answer choices are usually four different Venn diagrams. Your task is to determine which diagram accurately represents the given information. This is like doing the reverse of the above – instead of drawing your own diagram and computing a number, you must evaluate which provided diagram fits all the conditions.
What to do:
Break down each statement. Translate the verbal information into Venn relationships piece by piece. For example, suppose the scenario says: “All surgeons are doctors. No surgeon is a dentist. Some doctors are dentists.” From these:
“All surgeons are doctors” means the Surgeon circle should lie entirely within the Doctor circle (no surgeon outside of doctor).
“No surgeon is a dentist” means the Surgeon circle and Dentist circle do not overlap at all.
“Some doctors are dentists” means the Doctor and Dentist circles do overlap (and not just completely one inside the other; “some” implies a partial overlap where there are doctors who are dentists and doctors who are not dentists).
Now, keep these relationships in mind.
Use elimination. This is prime territory for eliminating diagrams that violate any single condition. Skim through the answer diagrams:
If a diagram shows the surgeon circle overlapping with the dentist circle, it’s immediately wrong (because “no surgeon is a dentist” was given).
If a diagram shows surgeons outside of doctors, it’s wrong (“all surgeons are doctors” was given).
If a diagram shows the dentist circle entirely outside the doctor circle with no overlap, that would mean “no doctor is a dentist” (or “no overlap”), contradicting the “some doctors are dentists” condition – so eliminate that.
Ideally, only one diagram will satisfy all criteria.
Draw it yourself (if needed). Sometimes the quickest way is to sketch your own rough Venn diagram following the statements (like we did above), then simply match it to the correct option. This way, you rely less on holding all the logic in your head. Mark on your sketch which overlaps should be empty vs filled. In the example, you’d draw Doctor circle, put Surgeon circle completely inside Doctor (so that part’s done), and ensure Surgeon doesn’t touch Dentist. Then Dentist must overlap with Doctor somewhere (because some doctors are dentists), but not touch the Surgeon circle inside Doctor. You’d end up with something like a Dentist circle overlapping part of Doctor but disjoint from Surgeon. Now find the answer diagram that looks like that.
Beware of lookalikes. UCAT is sneaky – they often include one or two diagrams that look almost right. Pay attention to subtle differences: is one circle completely inside another or just partially overlapping? Is an overlap missing or present when it shouldn’t be? For instance, in the “surgeon-doctor-dentist” scenario, an incorrect option might show the dentist circle overlapping the doctor circle and unfortunately overlapping a tiny bit with surgeon (which would violate “no surgeon is a dentist”). Another option might have the dentist circle entirely within the doctor circle – does that fit “some doctors are dentists”? Actually, if dentist is entirely inside doctor, it implies all dentists are doctors (which might be fine if it doesn’t contradict anything) and also that some doctors are dentists (true). But if all dentists are doctors wasn’t stated, is that an assumption we can allow? This is where careful reading is needed: the original statements didn’t say “all dentists are doctors”, but they didn’t forbid it either. So you must judge if the diagram is still consistent with “some doctors are dentists.” In this case, a diagram with Dentist entirely inside Doctor does mean some (in fact, all) dentists are doctors, and still some doctors (those in the overlap region) are dentists – logically it fits the statements given, even though it provides a stronger condition than “some.” However, if another diagram shows a partial overlap between Doctor and Dentist (which also satisfies “some”) without extra assumptions, that one might be preferable as a direct match. These nuances can be tricky! When in doubt, the safest approach is to ensure only the given relationships hold in the diagram, and nothing that contradicts them.
If the problem statements include something like “From only the information above, we don’t know X”, that means the diagram shouldn’t assume anything about X. For example, in a classic UCAT question about mammals, birds, and egg-laying: “All humans are mammals. No humans lay eggs. Some mammals lay eggs. All birds lay eggs.” – one cannot be sure if those birds are mammals or not, because it wasn’t specified. The correct diagram reflected exactly what was stated and left the “birds vs mammals” relationship ambiguous (separate circles for birds and humans inside mammals, both inside the egg circle). Any diagram that made birds overlap or not overlap with mammals was adding info not confirmed by the statements, thus was incorrect. The takeaway: stick to the given facts, and if something isn’t determined by those facts, the correct diagram will be the one that doesn’t assume it.
This format is all about logical reasoning and careful attention to words like all, none, some, only, must, might. If you’ve studied syllogisms, it’s very similar but with visual answers. Practice translating a few statements into diagram sketches. It can actually be fun, like solving a riddle! And remember, as with all DM questions: if you’re unsure, eliminate what you can, then guess and flag. There’s no penalty for guessing, and you can revisit if time permits.
Top Strategies for Acing Venn Diagram Questions
Now that we’ve covered the formats, let’s summarise some overarching strategies and tips to help you conquer any Venn diagram question in the UCAT:
Revise the basics 🎓 – Ensure you’re confident with interpreting Venn diagrams and basic set logic. Review what terms like union (A ∪ B), intersection (A ∩ B), at least/at most, etc., mean in plain English. For instance, “at least one” means one or more (could be all), “exactly two” means no more and no less than two, “none” means zero. A quick refresh of GCSE-level set notation and probability (like the inclusion-exclusion principle) will pay off. Don’t worry – you won’t need formal notation in the exam, but understanding it can clarify your thinking.
Use a systematic approach 🗒️ – Jumping straight into complex overlaps can lead to confusion. Instead, approach methodically: sketch out the information, fill in what you can, and complete missing areas step by step. Start from the most overlapping data (e.g. “all three” or “both”) and work outwards. This structured technique helps prevent mistakes and ensures you don’t overlook any group. It also trains your brain to handle even the “obscure presentations” without getting thrown off – some Venn questions might be framed in unusual ways, but the same principles apply.
Identify and ignore irrelevant info 🚮 – Not everything you’re told will matter! Sometimes extra numbers or statements are included as red herrings. For example, a passage might include data about a third category when the question only asks about two, or give more detail than needed. Don’t fall into the trap of using all given numbers if the question doesn’t require them. Stay focused on what’s being asked. If a particular statistic or statement doesn’t affect the answer, leave it be – wasting time on it can only hurt you.
Eliminate impossible answers first 🚫 – Whether it’s a list of statements or a set of diagram options, use your reasoning to quickly discard options that violate key facts. This is especially useful under time pressure. For instance, if you know from the question that “some A are not B,” then any answer choice that implies “all A are B” is immediately wrong. Each elimination improves your odds if you need to guess, and often you’ll narrow it down to one clear winner.
Mind the wording 📝 – Pay extra attention to words like “only,” “all,” “none,” “at least,” “exactly,” etc. These define the logic of the overlaps. Example: “Only 5 students joined the science club” implies those 5 did not join any other club (that segment is exclusively science). Meanwhile, “At least 5 students joined the science club” could mean 5 or more, leaving room for overlaps. Misreading these qualifiers is a common source of error. Practice interpreting such phrases correctly. It might help to rephrase them in your head: e.g. “only in science club” or “at least 5 (could be in multiple clubs)”, to be clear on their meaning. As one high-scoring candidate put it, understanding the precise wording can completely change the meaning of the question and thus the correct answer.
Use your whiteboard and pen ✏️ – During the exam, you’ll have an erasable noteboard. Use it! Draw small Venn sketches for complex problems, jot down numbers, or mark eliminated options. Many top scorers mention that drawing things out (be it Venn diagrams for these questions or diagrams for logic puzzles) hugely improved their accuracy. It doesn’t have to be pretty – even a quick doodle of overlapping circles with a few labels can anchor your thoughts and prevent confusion between similar-sounding groups.
Practice mental maths ➕ – As noted, most calculations in Venn questions are simple additions or subtractions. If mental arithmetic isn’t your strong suit, spend a little time practising adding multiple two-digit numbers, or subtracting under 100, etc., without a calculator. You can also practice tricks like the last-digit addition trick we showed earlier. The faster you can compute, the more time you’ll have to think and double-check. Also be comfortable with basic probabilities (if they ask something like “what is the probability a randomly chosen person from this diagram has property X,” you should know it’s count with X divided by total count).
Don’t overcomplicate 🔎 – Venn questions might look daunting when they involve three circles or unfamiliar scenarios, but they rarely require advanced techniques beyond what we’ve discussed. If you find yourself writing down complex equations or considering very unlikely interpretations, pause. You might be overthinking it. Go back to basics: re-read the question, re-draw the diagram slowly, and ensure you haven’t misinterpreted a statement. Often the simplest reading is correct. And if a question truly stumps you, remember you can flag and return later. It’s better to make an educated guess and move on than to spend five minutes spiraling into confusion.
Timing strategy ⏱️ – In Decision Making, you have roughly 1 minute per question on average (35 questions in 37 minutes). Venn diagram questions, once you’re practiced, can be answered in well under a minute because they’re often more straightforward than, say, a lengthy logical puzzle. In fact, many students find these to be quick wins. However, if you hit a particularly tricky one (maybe a nasty three-circle algebraic puzzle), be mindful of the clock. Use the flag-and-guess strategy for any question that isn’t clicking after ~60 seconds. You can always come back if time allows. It’s not worth sacrificing several other questions’ answers for one tough cookie. That said, aim to reach a level where most Venn problems feel almost routine – practice will get you there.
Final Thoughts 💭
Venn diagram questions in UCAT Decision Making are all about clarity and strategy. With a clear visualisation of overlaps and a methodical approach to the maths, you’ll find these questions much less intimidating. Many candidates actually enjoy Venn questions once they get the hang of them – there’s a satisfaction in quickly sorting out the puzzle and arriving at the correct answer! 😃
Remember, even though these questions involve logic and numbers, they are not designed to be fiendishly difficult. In fact, as we saw from the UCAT Consortium’s own analysis, students tend to score well on Venn diagram items compared to other DM question types. They’re testing fundamental reasoning skills that you likely already have; you just need to apply them under exam conditions.
So, practice converting words to diagrams, practice speedy calculations, and practice identifying exactly what each question wants. With these skills, you’ll be able to break down Venn diagram questions efficiently – visualising group overlaps and doing fast maths almost on autopilot.
Finally, stay calm and confident during the test. If you encounter a convoluted Venn question, take a deep breath. You now have the tools to disentangle it. And if it truly seems unsolvable in the moment, don’t panic – use your best reasoning to eliminate wrong answers, pick the most plausible option, flag it, and move on. Often, coming back with fresh eyes (if time permits) can help things click.
In summary: Venn diagram questions can be your ally in boosting your UCAT DM score. Approach them with a clear mind and the techniques you’ve learned here. You’ll soon be answering these questions quickly and accurately, gaining points and confidence on your path to medical or dental school. Good luck, and happy diagramming! 🎉
Further reading: UCAT Decision Making (DM)
Looking to improve your UCAT Decision Making score? These Blue Peanut guides cover the main DM question types (syllogisms, logic puzzles, probability, Venn diagrams, inference and strongest argument) with strategies and exam-style tips.
References and Further Reading 📚
UCAT Consortium – Candidate Advice: Tips for Decision Making. Emphasises the importance of practising Venn diagrams and basic probability for the DM subtest.
UCAT Consortium – 2024 Technical Report. Analysis of DM question types showing Venn diagram items were among the easiest, highlighting the value of mastering them.